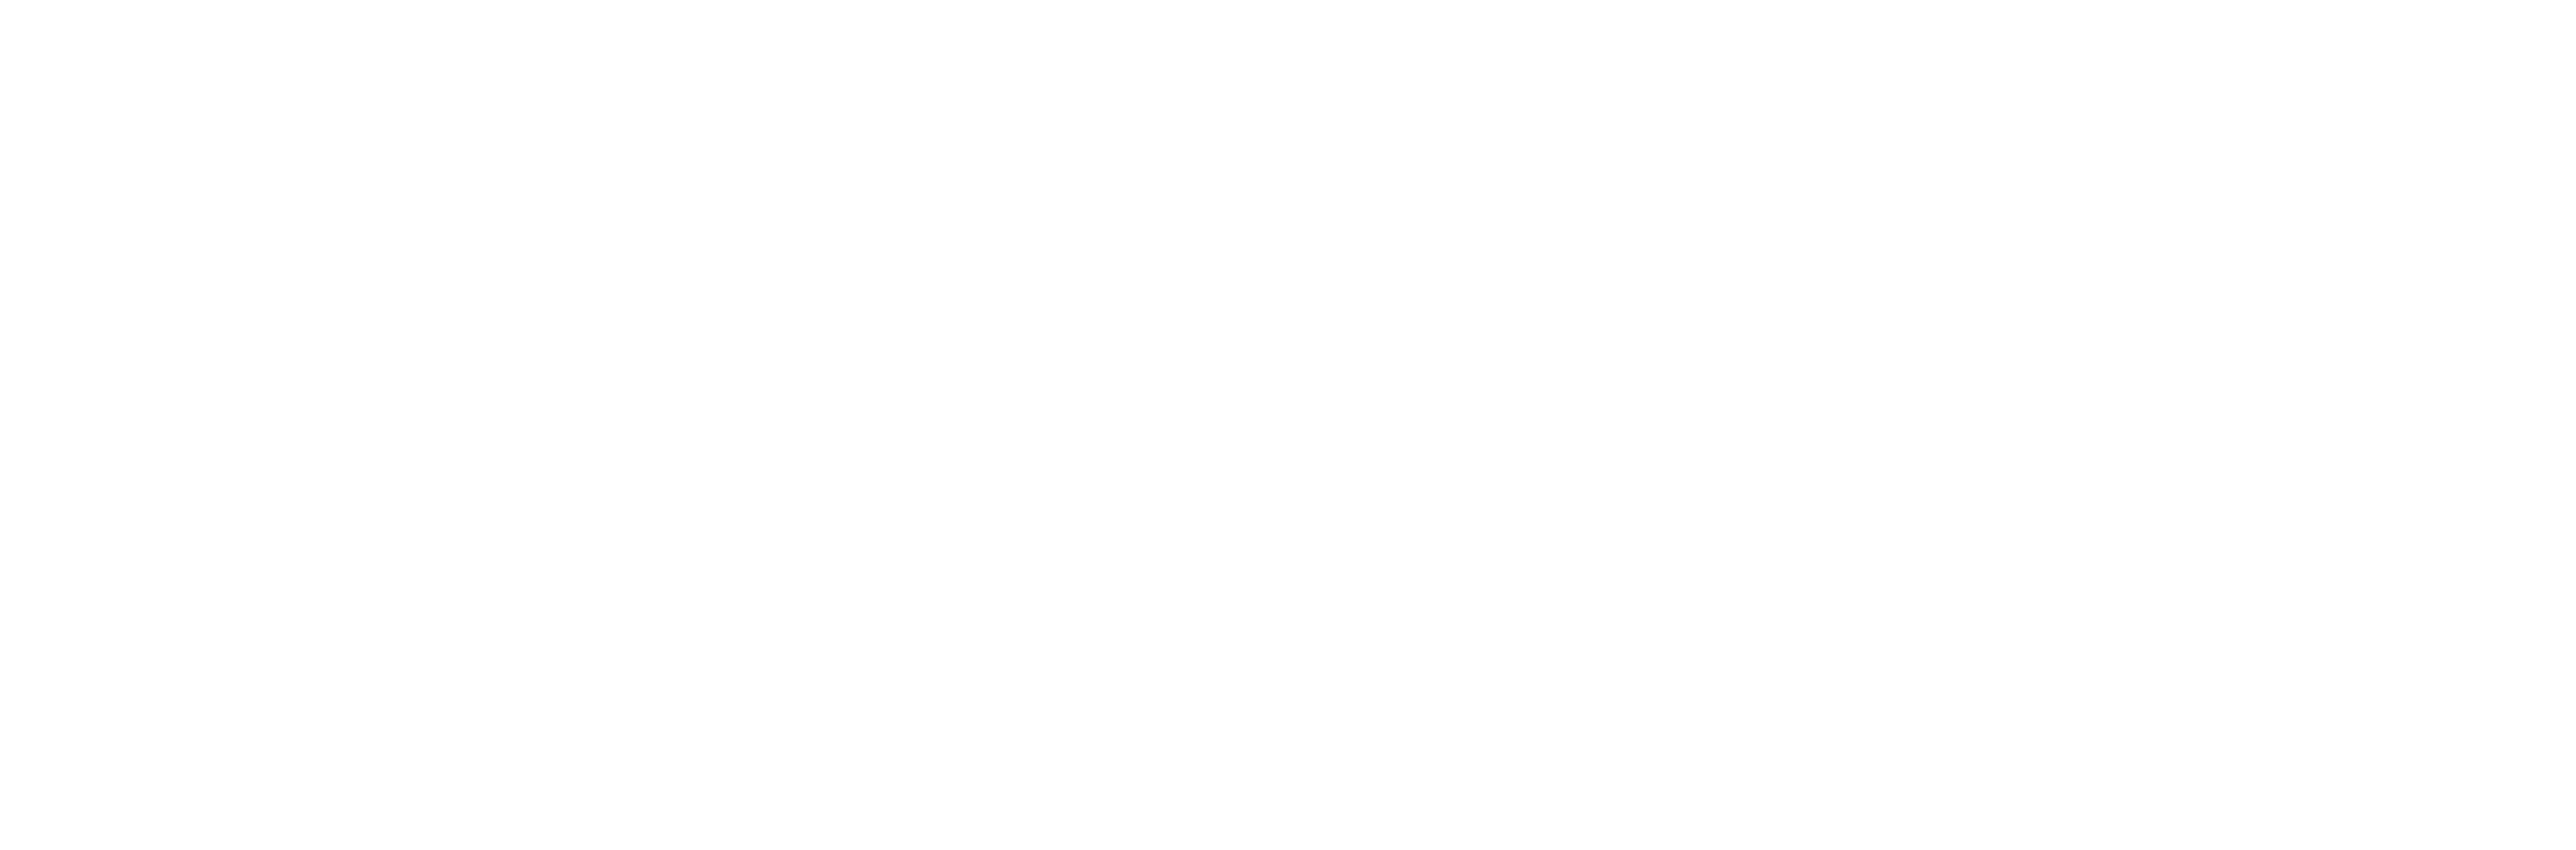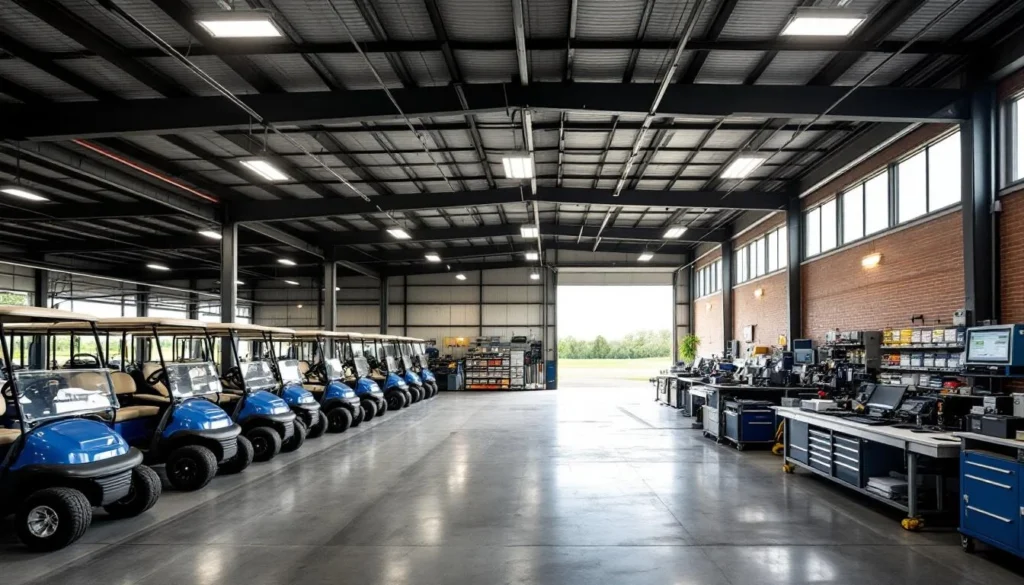
Golf course consolidation has jumped 23% since 2019, fundamentally changing the math on fleet maintenance for multi-facility operators. Facilities managing 200+ units across consolidated portfolios are seeing 31-42% reduction in per-unit maintenance costs. How? Strategic parts procurement and centralized fleet management protocols.
This analysis examines data-driven strategies for distributors and dealers serving consolidating operators who want better golf course fleet maintenance ROI.
Market Context: Consolidation Reshaping Golf Facility Economics
The golf course ownership landscape has undergone structural transformation. According to the National Golf Foundation, the U.S. golf facility count fell from 15,372 in 2019 to 14,899 in 2023—while management consolidation moved inversely. Multi-facility operators now control roughly 38% of all U.S. golf courses, up from 29% in 2018.
This consolidation directly impacts fleet maintenance economics.
Single-facility operations typically manage 40-120 golf carts with decentralized procurement and maintenance. Consolidated operators manage portfolios of 500-2,000+ units across 5-30 facilities, enabling fundamentally different cost structures through economies of scale.
The financial imperative is substantial. Golf facility operating costs climbed 18% from 2019-2023, per Golf Course Industry magazine’s annual operations survey. Within that cost structure, fleet maintenance represents 8-12% of total operating expenses. For a typical 18-hole facility generating $2.5M annual revenue, fleet maintenance costs range from $200,000-$300,000 yearly.
Consolidated operators have responded by implementing centralized fleet management strategies that use purchasing power, standardize maintenance protocols, and optimize parts inventory management. These strategies fundamentally alter the distributor-operator relationship—and create opportunities for dealers and wholesale suppliers positioned to serve multi-facility portfolios.
Fleet Maintenance Cost Structure Analysis: The Consolidation Advantage
Where exactly do consolidated operators achieve substantial golf course fleet maintenance ROI improvements? Research conducted by the Golf Course Superintendents Association of America (GCSAA) in partnership with operational consultants identifies four primary cost categories:

Parts Procurement Economics
Parts represent 45-52% of total fleet maintenance costs across industry benchmarks. Single-facility operators typically purchase parts through local dealers at standard commercial pricing—limited volume leverage. Orders average 15-30 line items monthly, generating $3,500-$8,000 monthly parts expenditure for a 75-unit fleet.
Consolidated operators managing 500+ units across multiple facilities achieve 22-35% cost reduction through strategic procurement. Volume commitments enable direct wholesale relationships, eliminating dealer markup structures. A consolidated operator managing 800 units purchasing through optimized wholesale channels reduces annual parts expenditure from approximately $480,000 to $312,000-$374,000.
That’s $106,000-$168,000 annual savings.
This procurement transformation requires suppliers capable of supporting centralized ordering, multi-location delivery, and inventory management systems. Forward-thinking distributors have developed B2B platforms enabling consolidated operators to maintain facility-level ordering autonomy while capturing enterprise-level pricing.
Labor Efficiency and Standardization
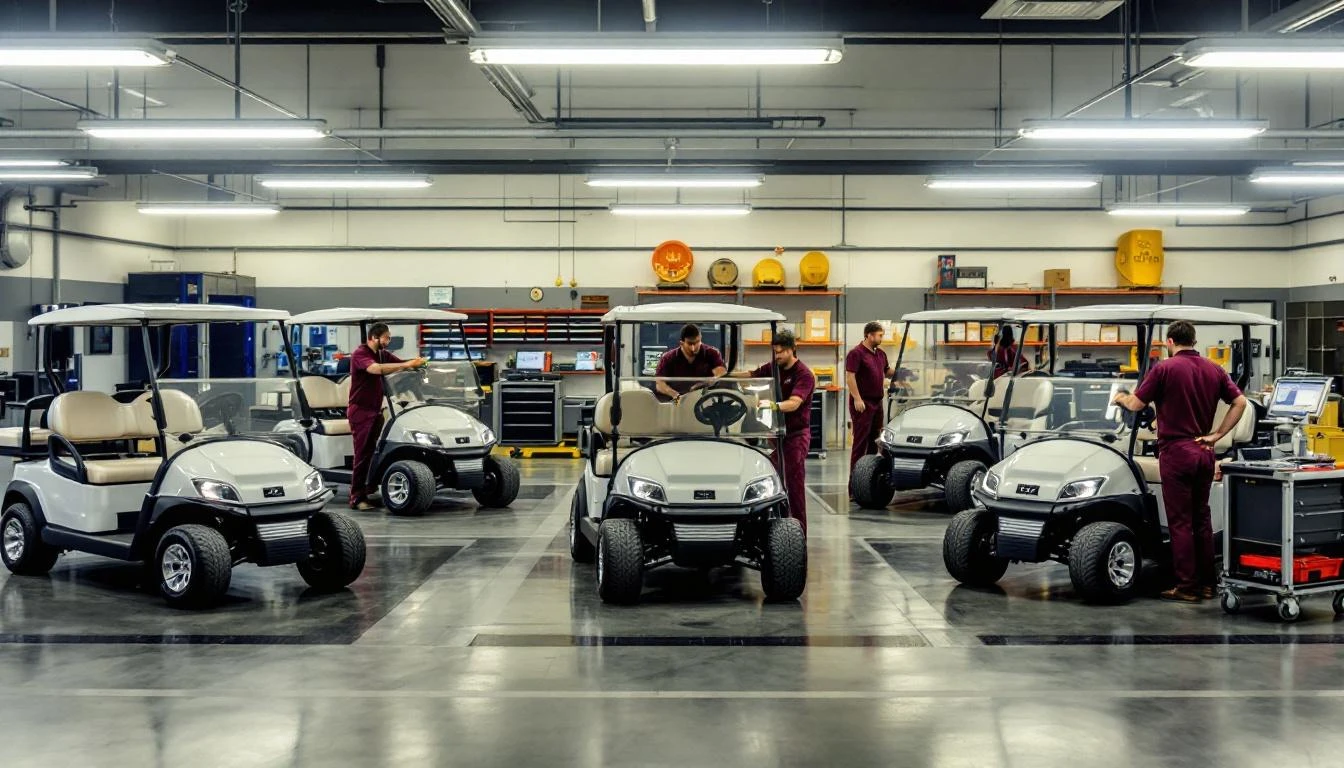
Labor represents 38-42% of fleet maintenance costs. Consolidated operators reduce per-unit labor costs through standardized maintenance protocols and fleet composition optimization. Multi-facility operators increasingly specify single-brand fleets across portfolios, reducing diagnostic complexity and parts inventory requirements.
Industry data shows facilities operating single-brand fleets complete routine maintenance 18-24% faster than mixed-fleet operations. For a facility with two full-time maintenance technicians, this translates to roughly 8-11 hours weekly productivity gain—valued at $18,000-$25,000 annually in labor cost avoidance.
Standardization also enables centralized training programs and technical support infrastructure. Consolidated operators develop specialized maintenance teams with deep expertise in specific platforms, rather than generalists managing diverse equipment portfolios. This specialization improves diagnostic accuracy and reduces repeat-repair incidents by 27-33%, according to operational tracking data.
Inventory Management Optimization
Traditional single-facility operations maintain on-site parts inventory valued at $12,000-$35,000, with 25-40% of inventory representing slow-moving or obsolete stock. Consolidated operators implement centralized inventory management, reducing total inventory investment while improving parts availability.
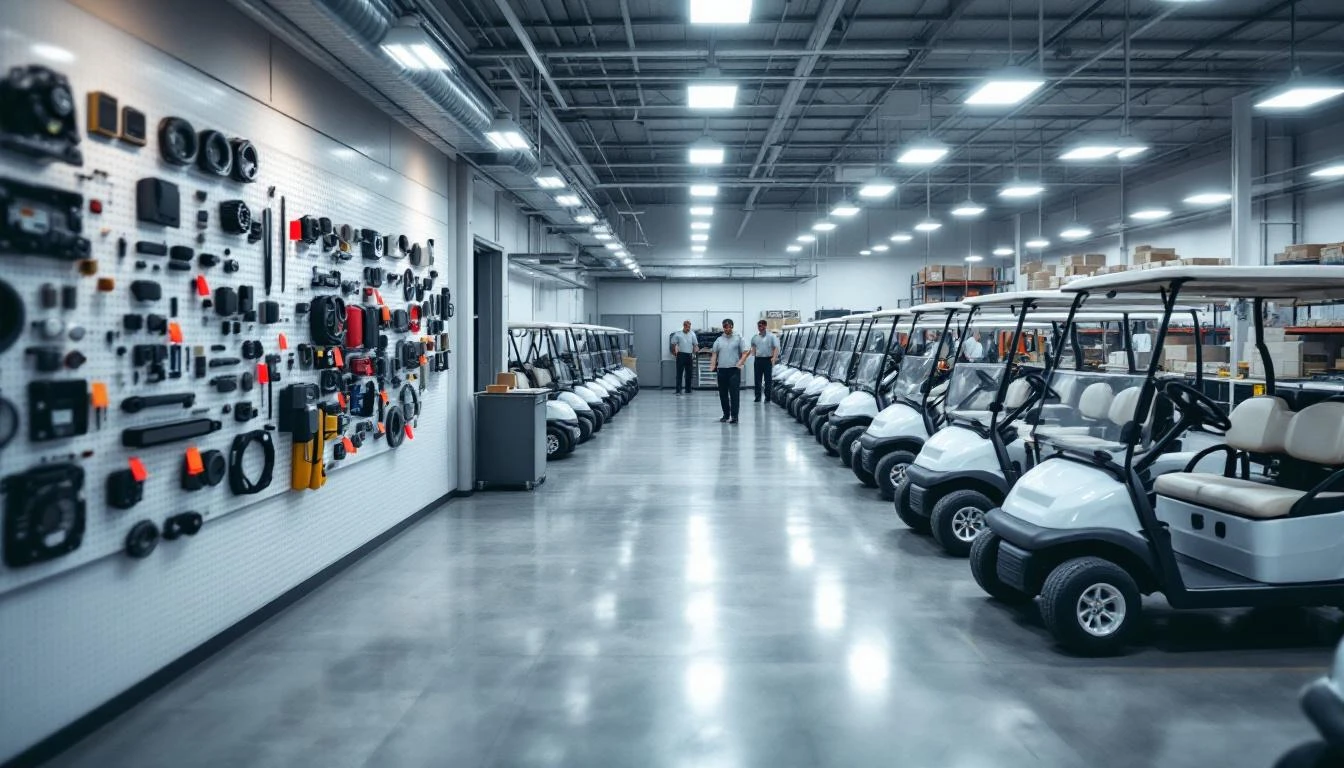
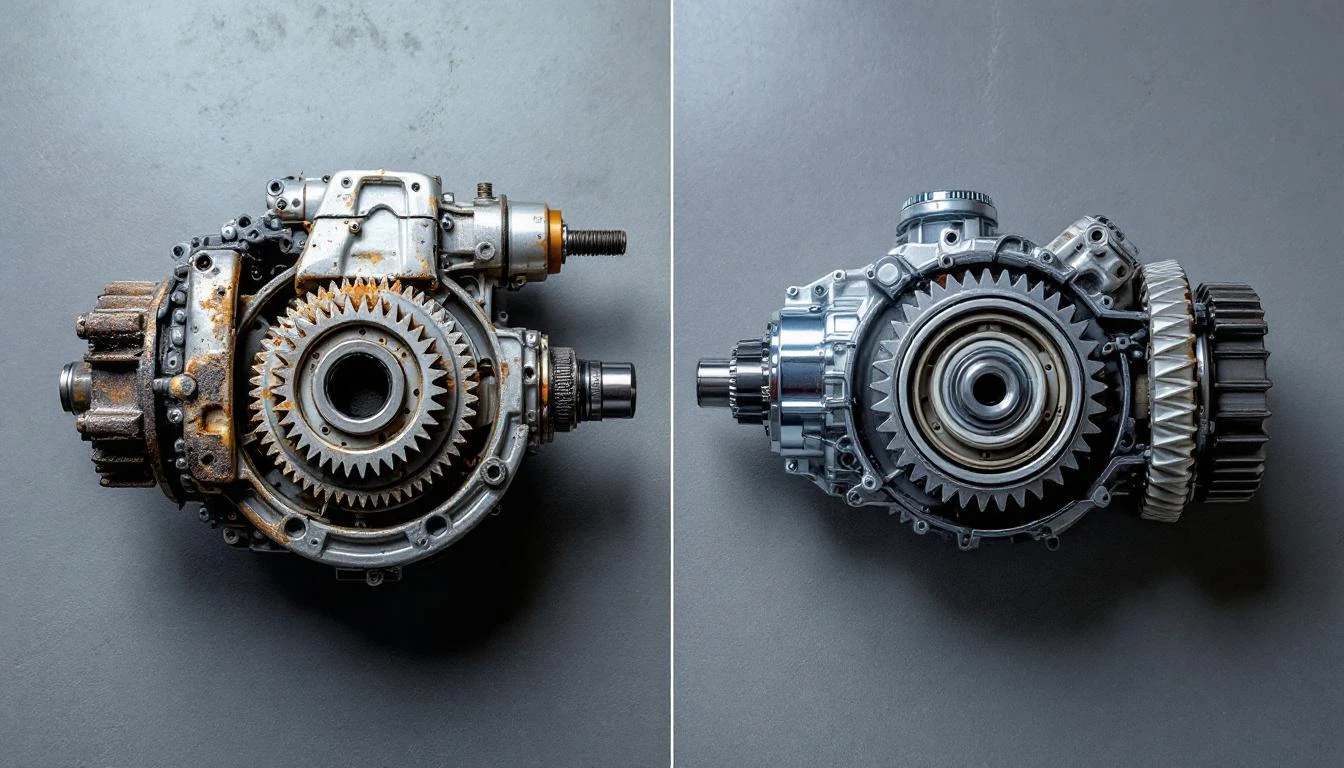
Leading consolidators use hub-and-spoke inventory models: centralized warehouses stock comprehensive parts inventory, while facility-level operations maintain minimal fast-moving consumables. This approach reduces total inventory investment by 35-48% while improving critical parts availability through next-business-day distribution from centralized facilities.
Data from operators managing 10+ facilities shows average inventory turns improving from 3.2x annually (single-facility baseline) to 7.1x annually under centralized management. This working capital optimization releases $85,000-$140,000 per 100 units in portfolio, available for redeployment to revenue-generating investments.
Preventive Maintenance Protocol Adherence
Deferred maintenance represents significant hidden costs in fleet operations.
Industry analysis indicates facilities with inconsistent preventive maintenance protocols experience 2.3x higher catastrophic failure rates and 1.8x higher total lifecycle costs compared to operations with rigorous preventive maintenance adherence.
Consolidated operators implement digital fleet management systems tracking maintenance schedules, component lifecycles, and failure patterns across portfolios. This data-driven approach improves preventive maintenance compliance from industry-average 67% to 91-96% for leading operators. The financial impact? Facilities improving preventive maintenance adherence from 67% to 93% reduce annual per-unit maintenance costs by $127-$183 per vehicle.
Strategic Procurement Models for Cost Reduction
Consolidated operators have developed procurement strategies that fundamentally alter traditional distribution relationships. Understanding these models is essential for dealers and distributors seeking to serve this expanding market segment.
Volume Commitment Agreements
Multi-facility operators use predictable annual parts consumption to negotiate volume-based pricing agreements. A typical consolidated operator managing 600 units with standard 6-year replacement cycles maintains consistent new vehicle acquisition (100 units annually) and generates predictable annual parts demand of $360,000-$520,000.
This volume predictability enables annual supply agreements with tiered pricing based on commitment levels. Operators committing to specific annual volumes access pricing typically 18-28% below standard dealer levels. Agreement structures include quarterly true-ups, allowing flexibility for operational variations while maintaining volume targets.
For distributors, these agreements provide revenue predictability and operational efficiency. Order consolidation, standardized fulfillment processes, and reduced sales cycle friction reduce cost-to-serve by 31-38% compared to transactional single-facility relationships.
Just-In-Time Delivery Integration
Leading consolidated operators implement just-in-time delivery protocols, minimizing facility-level inventory while ensuring parts availability. This requires distributor capabilities for rapid order fulfillment and multi-location delivery logistics.
Operators utilizing JIT delivery reduce facility-level inventory carrying costs by 62-74% while maintaining 97%+ parts availability for scheduled maintenance. This requires distributor investment in inventory management systems, regional distribution infrastructure, and logistics capabilities—but creates substantial competitive differentiation and customer retention.
Data shows operators implementing JIT delivery with qualified distribution partners reduce emergency expedited shipping costs by 83% compared to operations relying on local retail dealer networks for urgent parts needs.
Private Label and OEM-Equivalent Programs
Cost-conscious consolidated operators increasingly specify OEM-equivalent and private label components for non-critical applications. Industry research indicates 47% of multi-facility operators now use OEM-equivalent parts for specific applications, up from 31% in 2019.
Quality OEM-equivalent components for applications such as brake pads, batteries, and wear components deliver 15-35% cost savings with comparable performance characteristics. A 500-unit fleet operation substituting OEM-equivalent components for appropriate applications reduces annual parts expenditure by $32,000-$67,000 while maintaining operational reliability.
This trend creates opportunities for distributors offering comprehensive product portfolios including both OEM and high-quality alternative components. The key differentiator? Technical expertise—helping operators identify appropriate applications for alternatives while recommending OEM components where performance requirements demand original specifications.
Data-Driven Fleet Management: Technology Enablement
Technology adoption has become a critical differentiator in fleet maintenance efficiency. Consolidated operators utilizing digital fleet management platforms demonstrate 23-29% improvement in overall maintenance efficiency compared to operations relying on manual tracking systems.
Predictive Maintenance Analytics
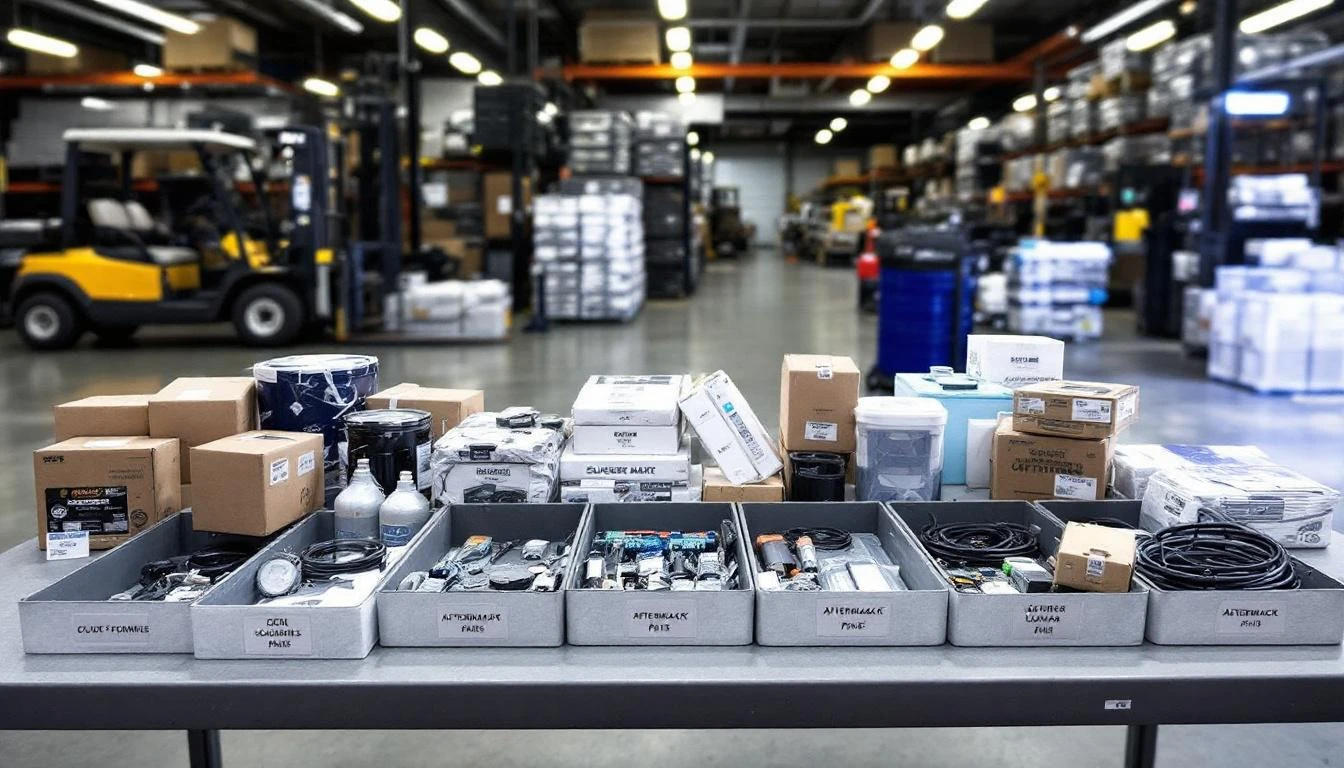
Advanced operators implement telematics and diagnostic systems that enable predictive maintenance protocols. Fleet management platforms track vehicle utilization, battery performance, motor temperature variations, and other operational parameters that indicate developing issues before catastrophic failure.
Operators utilizing predictive maintenance systems reduce unscheduled downtime by 41-53% and extend average component lifecycle by 14-22%. For a 100-unit fleet, this translates to approximately $18,000-$31,000 annual savings through reduced emergency repairs and extended component life.
This technology trend creates new requirements for parts suppliers: consolidated operators increasingly demand detailed component specifications, failure rate data, and lifecycle information to optimize predictive maintenance algorithms. Distributors providing this technical data integration develop stronger strategic relationships with sophisticated operators.
Digital Procurement Platforms
Consolidated operators require B2B procurement platforms enabling facility-level ordering with centralized visibility and control. Leading operators implement systems providing real-time parts availability, pricing transparency, order tracking, and invoice consolidation across multi-facility portfolios.
Distributors investing in B2B e-commerce capabilities optimized for multi-facility operations report 37% higher customer retention and 2.8x larger average order values compared to operations without digital procurement infrastructure. Platform capabilities including custom catalogs, approval workflows, budget controls, and analytics dashboards have become table-stakes for serving sophisticated consolidated operators.
What This Means for Dealers and Distributors
Golf course consolidation represents both challenge and opportunity for the distribution channel. Traditional single-facility dealer relationships face margin pressure and volume erosion, while distributors positioned to serve consolidated operators access larger accounts with greater revenue predictability.
Opportunity Sizing
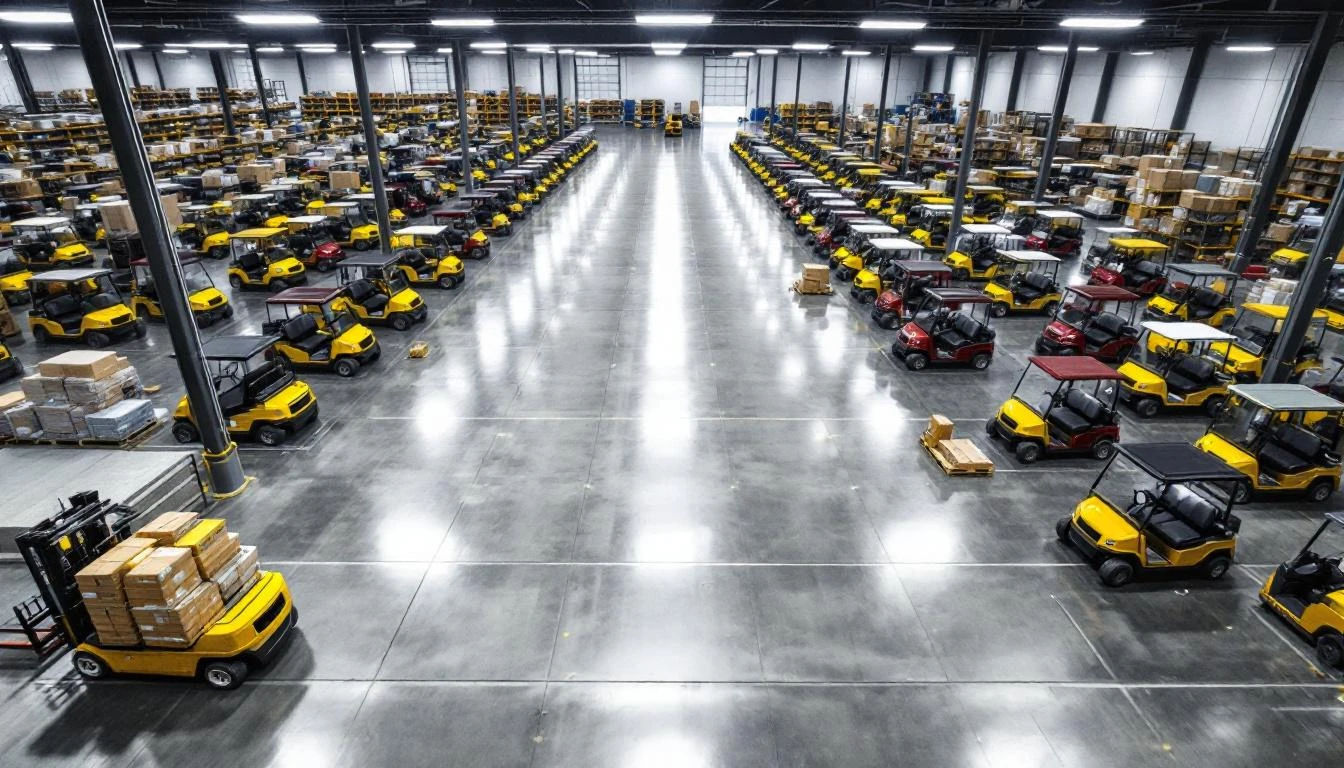
Multi-facility operators managing 500+ units represent 41% of total U.S. golf cart fleet population while comprising only 8% of facility count. This concentration creates substantial account opportunity for distributors capable of serving enterprise requirements.
Average annual parts and service revenue per consolidated operator account ranges from $280,000-$750,000, compared to $35,000-$95,000 for typical single-facility accounts. But these accounts require different capabilities: centralized procurement, multi-location logistics, volume pricing structures, and technical support infrastructure.
Required Capability Development
Dealers and distributors seeking to capture consolidated operator business must develop specific capabilities:
Strategic account management: Consolidated operators require dedicated account management with understanding of multi-facility operational complexity. Transactional order-taking relationships won’t cut it. Successful distributors provide strategic partnership including inventory optimization consultation, lifecycle planning, and operational efficiency analysis.
Logistics infrastructure: Multi-location delivery capability is non-negotiable. Operators expect reliable delivery to 5-30 facility locations with consistent service levels. This requires investment in distribution infrastructure, carrier relationships, and logistics management systems.
Technical expertise: Consolidated operators increasingly employ sophisticated fleet managers with technical backgrounds. Distributors must provide equivalent technical expertise, including application engineering support, failure analysis capabilities, and product specification consultation. Visit our comprehensive parts catalog to explore technical specifications and application data.
Digital integration: B2B e-commerce platforms, API integration with customer procurement systems, and digital invoicing/payment capabilities are essential for serving enterprise accounts efficiently. Manual processes create friction that sophisticated operators won’t tolerate.
Competitive Positioning
The consolidation trend creates natural market segmentation between distributors serving enterprise accounts and dealers serving single-facility operations. Both segments remain viable—but require different business models and capabilities.
Distributors pursuing enterprise consolidator accounts should expect 18-24 month sales cycles, formal RFP processes, and significant technical evaluation. But successful account acquisition typically results in 5-7 year customer relationships with high retention rates (92%+ for leading distributors) and predictable revenue streams.
Regional dealers may find opportunity in serving facilities shed by consolidators or providing specialized services (emergency repair, customization, seasonal preparation) complementing primary distribution relationships. The key is understanding your position in the evolving value chain and developing capabilities matched to target customer requirements.
Implementation Framework: Capturing Consolidation Opportunity
Dealers and distributors seeking to develop capabilities for serving consolidated operators should consider this phased implementation approach:
Phase 1: Capability Assessment and Gap Analysis (Month 1-2)
Conduct honest assessment of current capabilities against consolidated operator requirements. Evaluate logistics infrastructure, technical expertise, pricing flexibility, and digital platform capabilities. Identify specific gaps requiring investment or partnership development.
Analyze current customer base to identify emerging consolidation trends. Customers managing multiple facilities or experiencing ownership changes may represent near-term opportunity for enhanced service models.
Phase 2: Infrastructure Development (Month 3-8)
Invest in identified capability gaps. Priority areas typically include:
- B2B e-commerce platform implementation or enhancement
- Inventory management system optimization for multi-location fulfillment
- Account management training and resource allocation
- Technical documentation and specification data development
- Logistics partner evaluation and contract negotiation
During this phase, develop standardized processes, service level agreements, and operational protocols for multi-facility account management. Document workflows ensuring consistent service delivery across customer locations.
Phase 3: Target Account Development (Month 6-12)
Identify and pursue target accounts matching your capability profile. Focus initial efforts on operators managing 3-8 facilities, where requirements are substantial but competitive intensity may be lower than largest national consolidators.
Develop value propositions emphasizing specific capabilities: logistics reliability, technical expertise, inventory optimization, or pricing structure innovation. Differentiate on capabilities rather than competing solely on price—consolidated operators value total cost of ownership, not just unit price.
Expect extended sales cycles.
Provide operational data, customer references, and capability demonstrations supporting claims. Pilot programs with limited scope (single facility or product category) can demonstrate value before full portfolio commitment.
Phase 4: Relationship Expansion and Optimization (Month 12+)
Once initial accounts are established, focus on deepening relationships through continuous improvement and expanded service offerings. Implement regular business reviews analyzing performance metrics, identifying optimization opportunities, and demonstrating value contribution.
Use data from established accounts to refine operational processes and develop additional capabilities. Customer feedback drives capability development roadmap, ensuring investments align with market requirements.
Successful distributors report 40-60% account expansion within 24 months of initial engagement, as consolidated operators increase product categories, add facilities to distribution agreements, and consolidate additional volume with proven partners.
Actionable Next Steps for Distribution Partners
The golf course consolidation trend will continue reshaping fleet maintenance economics throughout the next decade. Dealers and distributors have finite time to develop capabilities required for serving this evolving market.
Organizations seeking to capture consolidation opportunity should:
Conduct immediate capability assessment: Evaluate your organization’s readiness to serve multi-facility operators against the requirements outlined in this analysis. Identify 2-3 highest-priority capability gaps requiring near-term investment.
Engage in strategic planning: Determine whether pursuing consolidated operator accounts aligns with your organization’s strategic direction and resource availability. This is a deliberate choice requiring multi-year commitment—ensure leadership alignment before initiating significant capability development.

Develop pilot programs: If pursuing consolidator accounts, identify 1-2 target opportunities for pilot engagement. Limited-scope pilots reduce risk while demonstrating capability and building customer confidence.
Invest in technical expertise: Regardless of strategic direction, technical capability development remains essential. Even single-facility operators increasingly demand sophisticated technical support. Invest in training, documentation, and expertise development to differentiate on value, not price.
For additional insights on optimizing your parts procurement strategy and serving the evolving golf facility market, explore our industry insights resource center featuring operational data, market analysis, and technical guidance.
Top Golf Cart Parts specializes in wholesale partnerships with dealers, distributors, and multi-facility operators seeking optimized parts procurement, technical support, and strategic inventory management. Our team provides consultation on fleet maintenance cost reduction strategies, parts specification optimization, and supply chain efficiency improvement.
Request a wholesale consultation to discuss how strategic parts procurement can enhance your golf course fleet maintenance ROI and support your multi-facility operational objectives. Our industry specialists analyze your specific fleet composition, maintenance protocols, and cost structure to identify actionable efficiency improvements and procurement optimization opportunities.
Frequently Asked Questions: Golf Course Fleet Maintenance ROI
What cost reduction percentage can consolidated golf course operators realistically achieve through optimized fleet maintenance strategies?
Data from multi-facility operators implementing comprehensive maintenance optimization programs shows per-unit cost reduction ranging from 28-42% compared to baseline single-facility operations. The specific reduction depends on initial operational maturity, fleet size, and implementation thoroughness. Operators managing 500+ units across multiple facilities with fully implemented programs (centralized procurement, standardized protocols, digital fleet management) consistently achieve the higher end of this range. Smaller consolidated operators managing 200-400 units typically realize 28-35% reduction. Critical success factors include volume-based procurement agreements (delivering 18-28% parts cost reduction), preventive maintenance protocol adherence improvement (reducing lifecycle costs by 15-22%), and inventory optimization (reducing carrying costs by 35-48% while improving availability).
How do wholesale parts procurement relationships differ from traditional dealer relationships for golf course fleet management?
Wholesale procurement relationships for consolidated operators differ fundamentally from traditional dealer models in structure, pricing, and service model. Traditional dealer relationships involve transactional purchasing at commercial pricing with dealer markup typically 35-55% above wholesale cost. Wholesale relationships provide direct pricing access, eliminating dealer margin and reducing parts costs by 22-35% for volume commitments. Service models also differ significantly: wholesale relationships emphasize strategic partnership with dedicated account management, inventory optimization consultation, multi-location logistics, and technical support infrastructure. Minimum volume requirements typically range from $150,000-$300,000 annual commitment, making wholesale relationships practical for operators managing 300+ units. Dealers continue serving single-facility operations and providing value-added services (installation, emergency repair, customization) that wholesale distributors typically don’t offer. The models are complementary rather than directly competitive, serving different market segments with distinct requirements.
What fleet size threshold makes centralized parts inventory management financially viable for multi-facility golf course operators?
Financial analysis indicates centralized inventory management becomes viable at approximately 250-300 total fleet units across multiple facilities. Below this threshold, the infrastructure investment (warehouse space, inventory management systems, logistics coordination) and operational overhead exceed savings from inventory optimization and volume purchasing. Operators managing 250-300 units can implement basic centralized inventory programs (centralized ordering with direct facility delivery) without dedicated warehouse infrastructure, achieving 15-22% inventory cost reduction. Full hub-and-spoke models with centralized warehouse and facility-level distribution become economically optimal at 500+ units, where inventory carrying cost reduction (35-48%) and improved parts availability justify infrastructure investment. Leading consolidated operators report centralized inventory programs deliver complete payback within 14-18 months for fleets exceeding 500 units, with ongoing annual savings of $85,000-$140,000 per 100 units in portfolio. Geographic concentration significantly impacts viability—operators with facilities within 150-mile radius achieve economies at lower fleet sizes than operators with widely dispersed geographic footprint.
How does fleet brand standardization impact maintenance costs for multi-facility golf course operations?
Fleet brand standardization delivers measurable maintenance cost benefits through reduced diagnostic complexity, streamlined parts inventory, and improved technician expertise. Industry data shows facilities operating single-brand fleets complete routine maintenance 18-24% faster than mixed-fleet operations, translating to approximately $18,000-$25,000 annual labor cost savings for typical facilities with two full-time maintenance technicians. Parts inventory requirements decrease by 40-52% under single-brand operations, as the elimination of brand-specific components reduces total SKU count and minimizes obsolete inventory. Technician specialization in single platforms improves diagnostic accuracy and reduces repeat-repair incidents by 27-33% compared to generalist technicians servicing diverse equipment. However, standardization requires careful implementation during fleet transition periods. Operators can’t economically replace entire fleets immediately; successful standardization programs implement 5-7 year transition timelines aligned with normal replacement cycles. During transition, operators manage hybrid fleets while progressively standardizing new acquisitions. Total lifecycle savings from brand standardization range from $127-$218 per unit annually for fleets exceeding 200 units.
What digital fleet management capabilities provide the highest ROI for golf course maintenance operations?
Digital fleet management capabilities delivering highest ROI fall into three categories: maintenance scheduling automation, predictive diagnostics, and parts inventory optimization. Maintenance scheduling automation improves preventive maintenance adherence from industry-average 67% to 91-96%, reducing total lifecycle costs by $127-$183 per vehicle annually through decreased catastrophic failures and extended component life. Implementation costs range from $15-$35 per vehicle for cloud-based scheduling platforms, delivering complete ROI within 3-5 months. Predictive diagnostic systems utilizing telematics and operational data reduce unscheduled downtime by 41-53% and extend component lifecycle by 14-22%, generating $18,000-$31,000 annual savings for 100-unit fleets. However, predictive systems require higher implementation investment ($125-$280 per vehicle) with 12-18 month payback periods. Parts inventory optimization platforms providing real-time availability, usage analytics, and automated reordering improve inventory turns from 3.2x to 7.1x annually while reducing stockouts by 73-84%. For operators managing centralized inventory across multiple facilities, these platforms deliver $12,000-$23,000 annual savings per facility. Priority implementation sequence should follow ROI timeline: maintenance scheduling first (fastest payback), followed by inventory optimization (medium payback), then predictive diagnostics (longest payback but highest long-term value for large fleets).